What follows is a statistical comparison between the Obama and Trump Administrations using various country-level economic performance indicators. The comparison includes thirty-seven months of the Trump Administration prior to the impact of Covid-19 on the US economy (Feb 2017 to Feb 2020) and the last thirty-seven months of the Obama Administration.
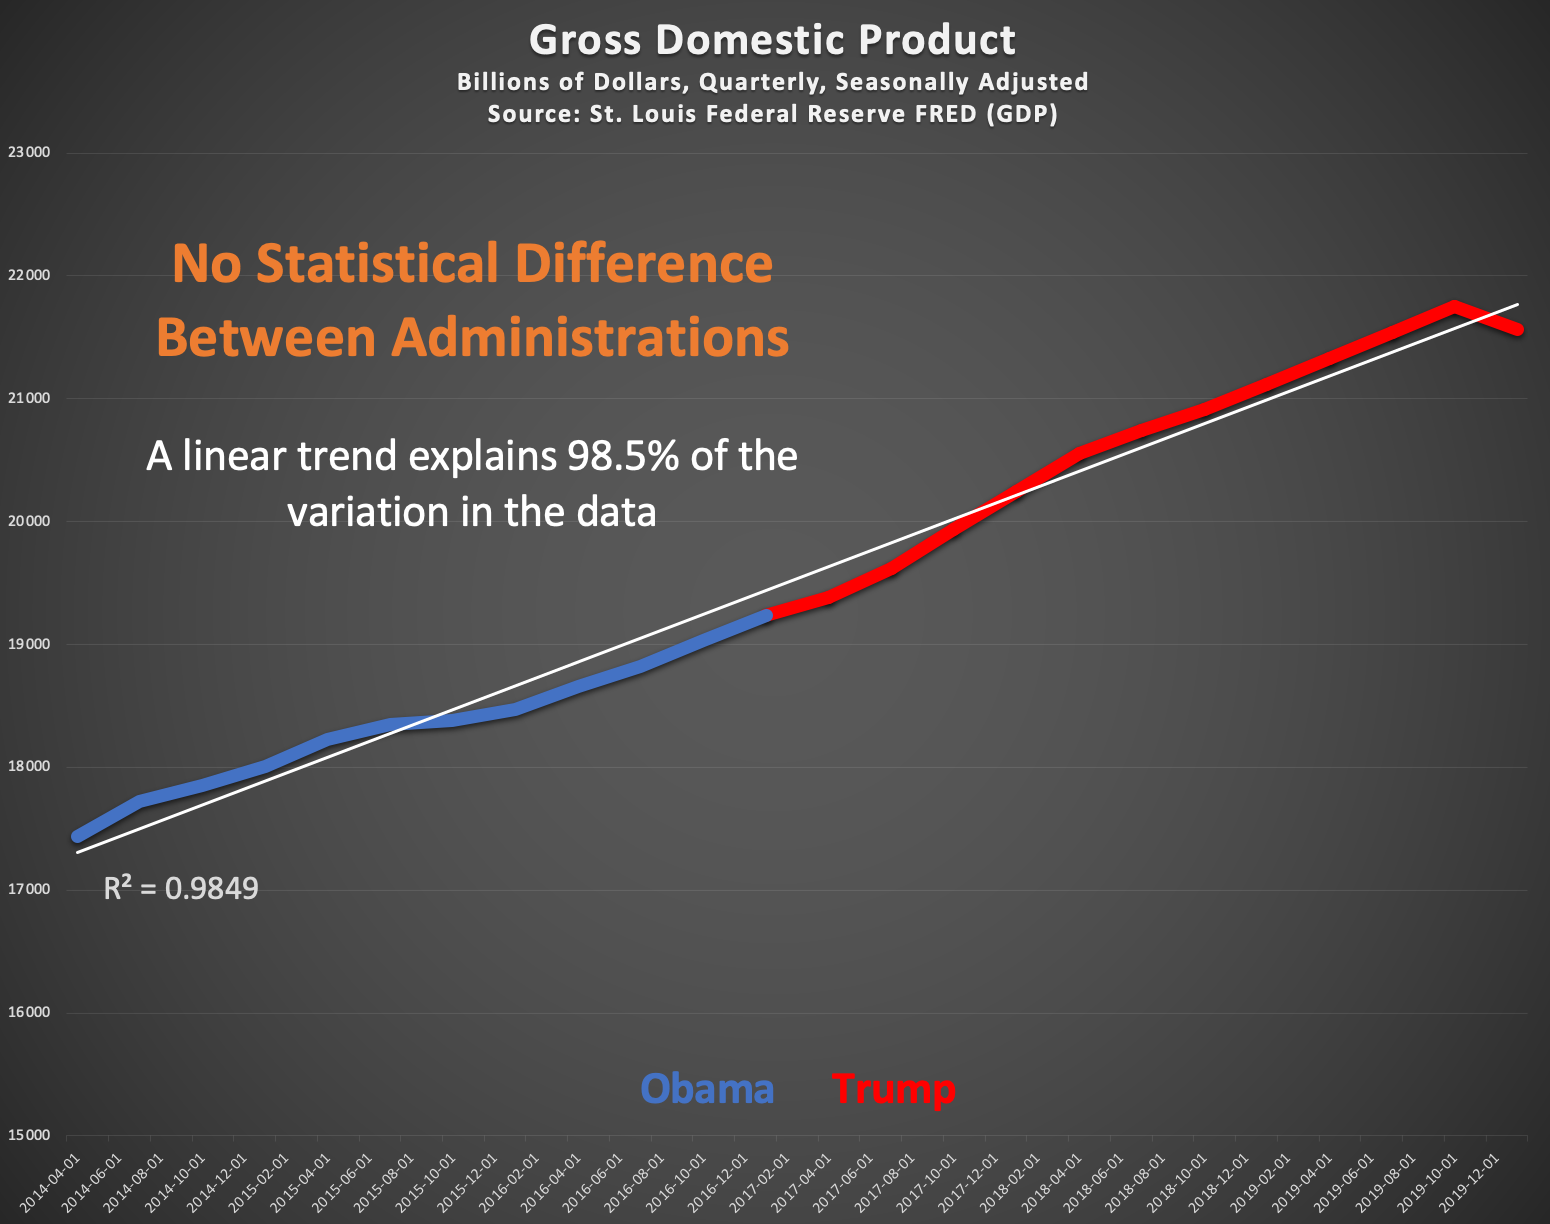
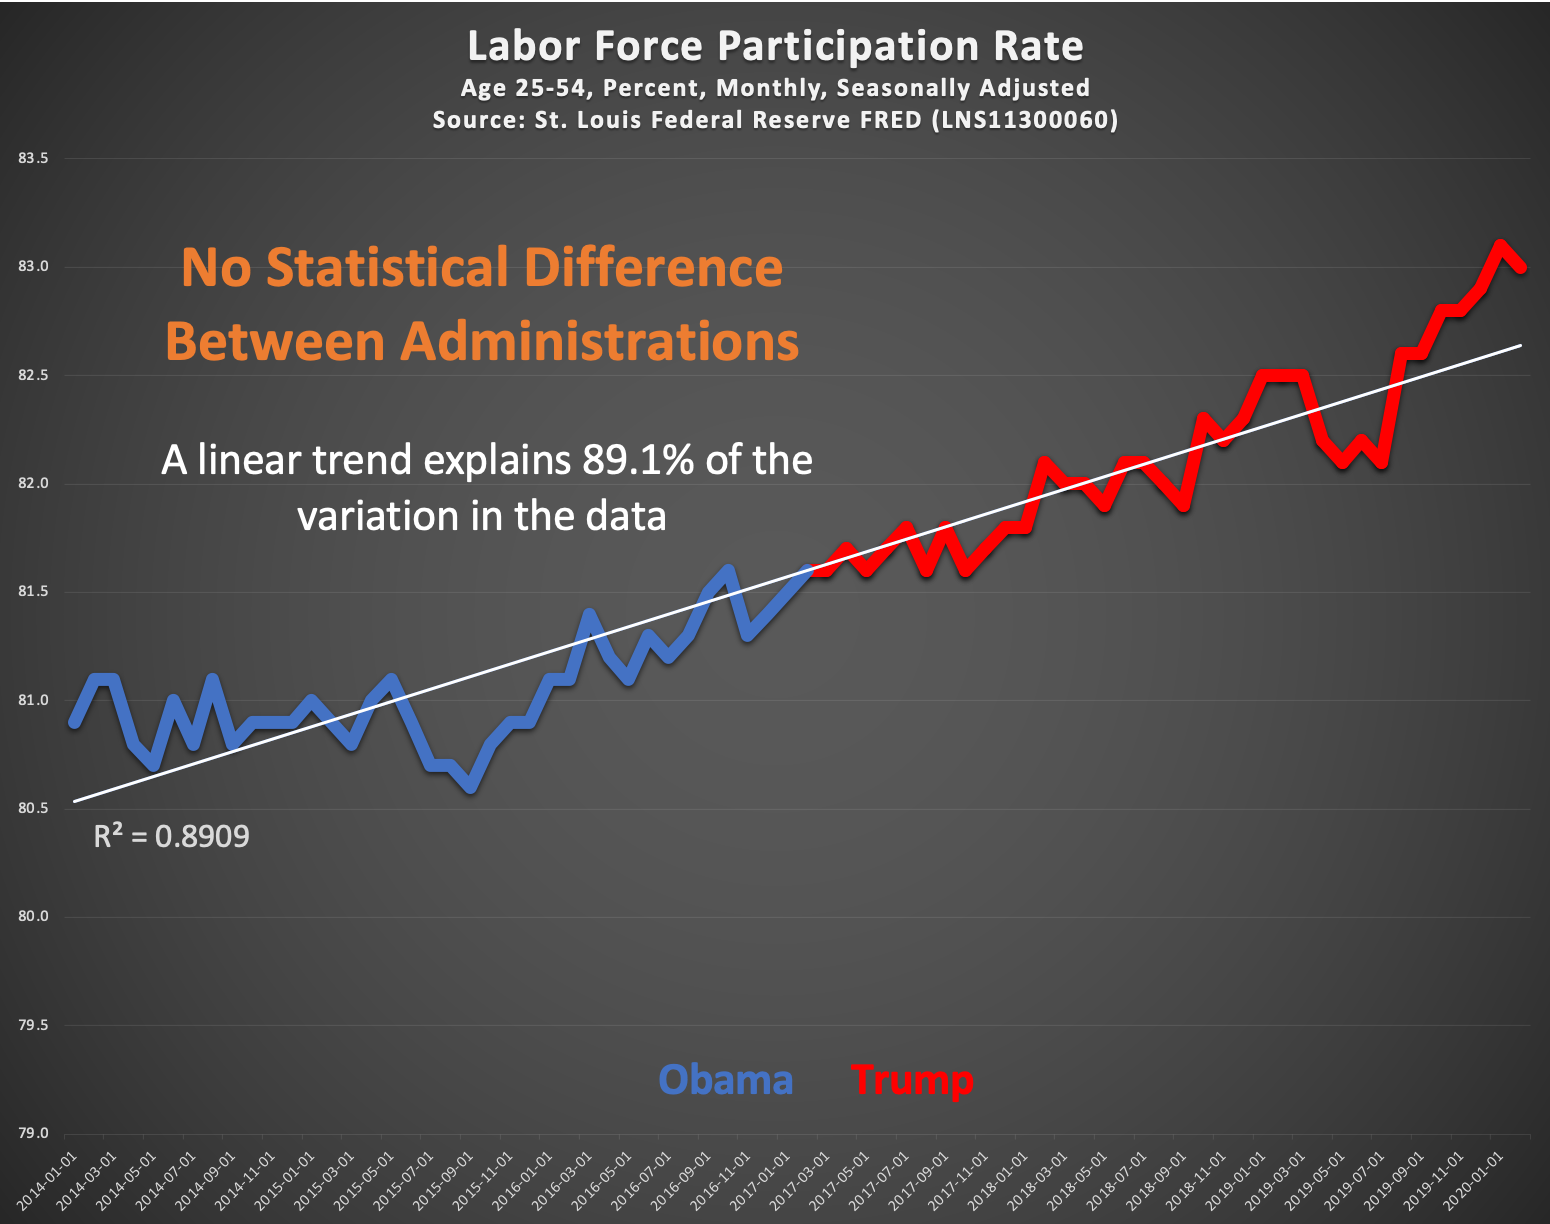
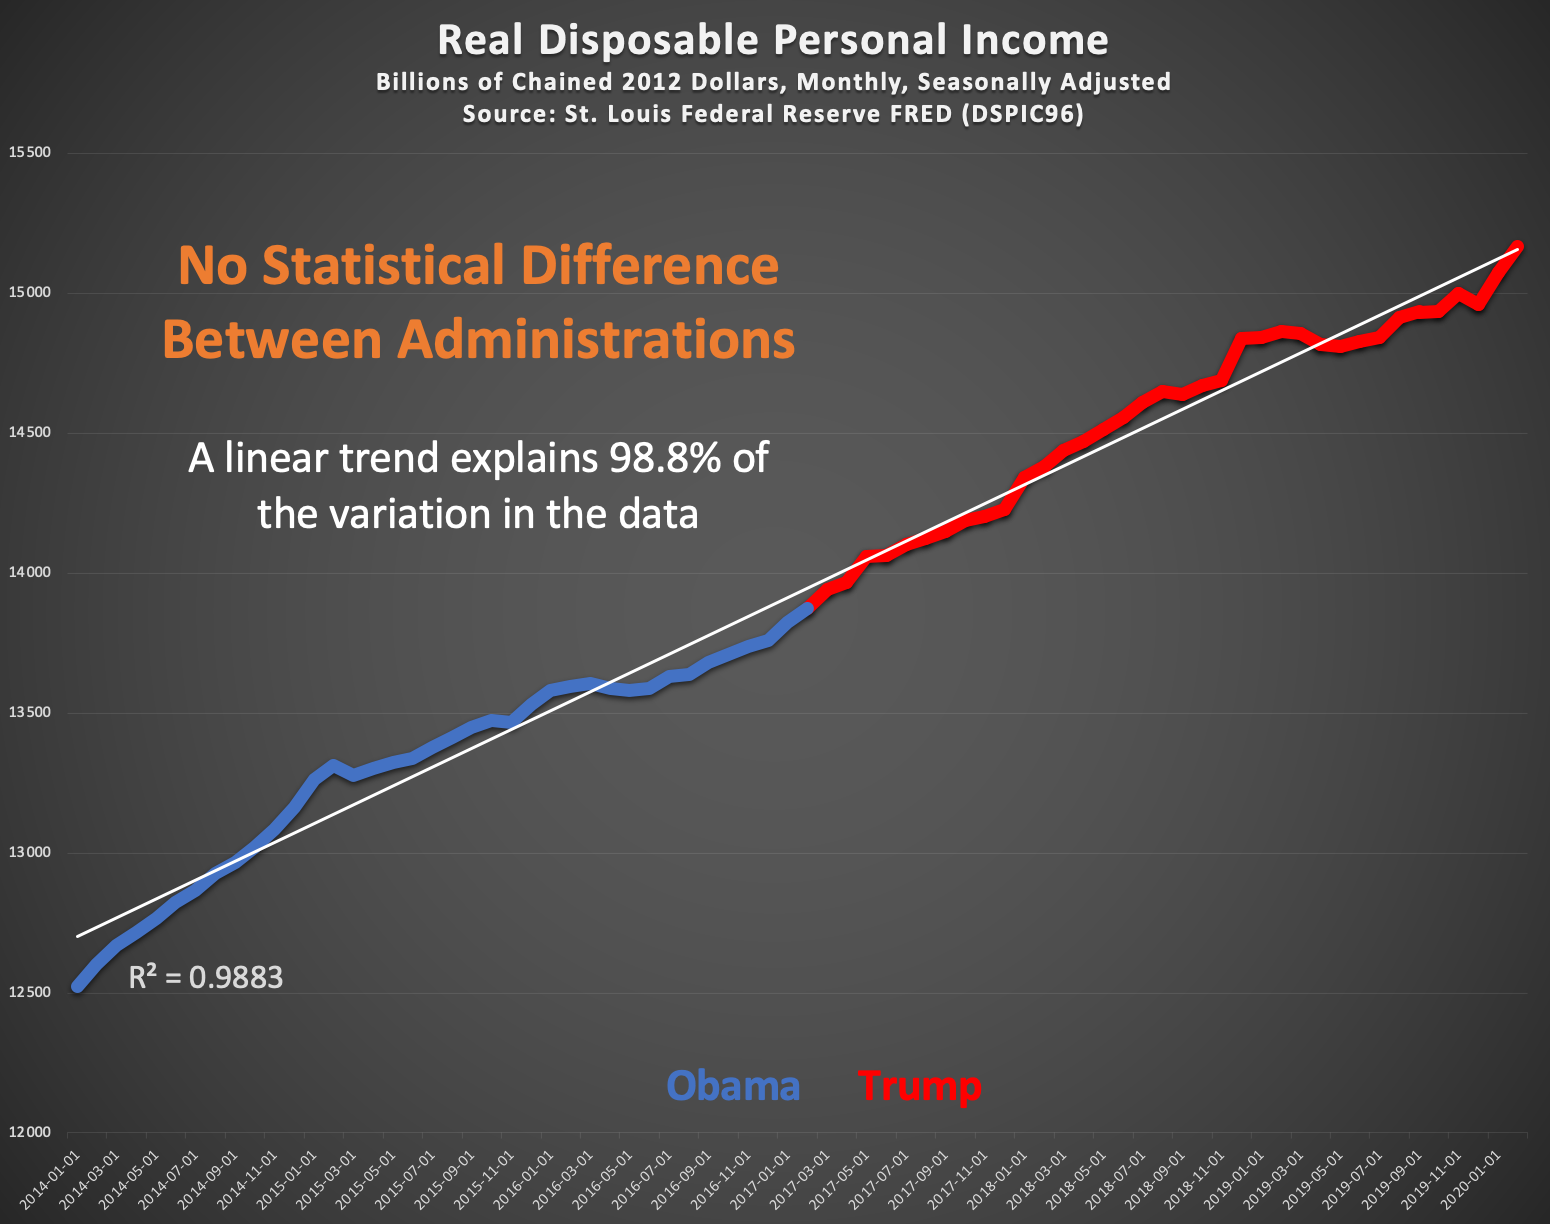
The Trump Administration economy appears to be a continuation of the ecnomic trends of the Obama Administration when measured by Gross Domestic Product (GDP), Real Disposable Personal Income, Labor Force Participation Rate, and Jobs Created.
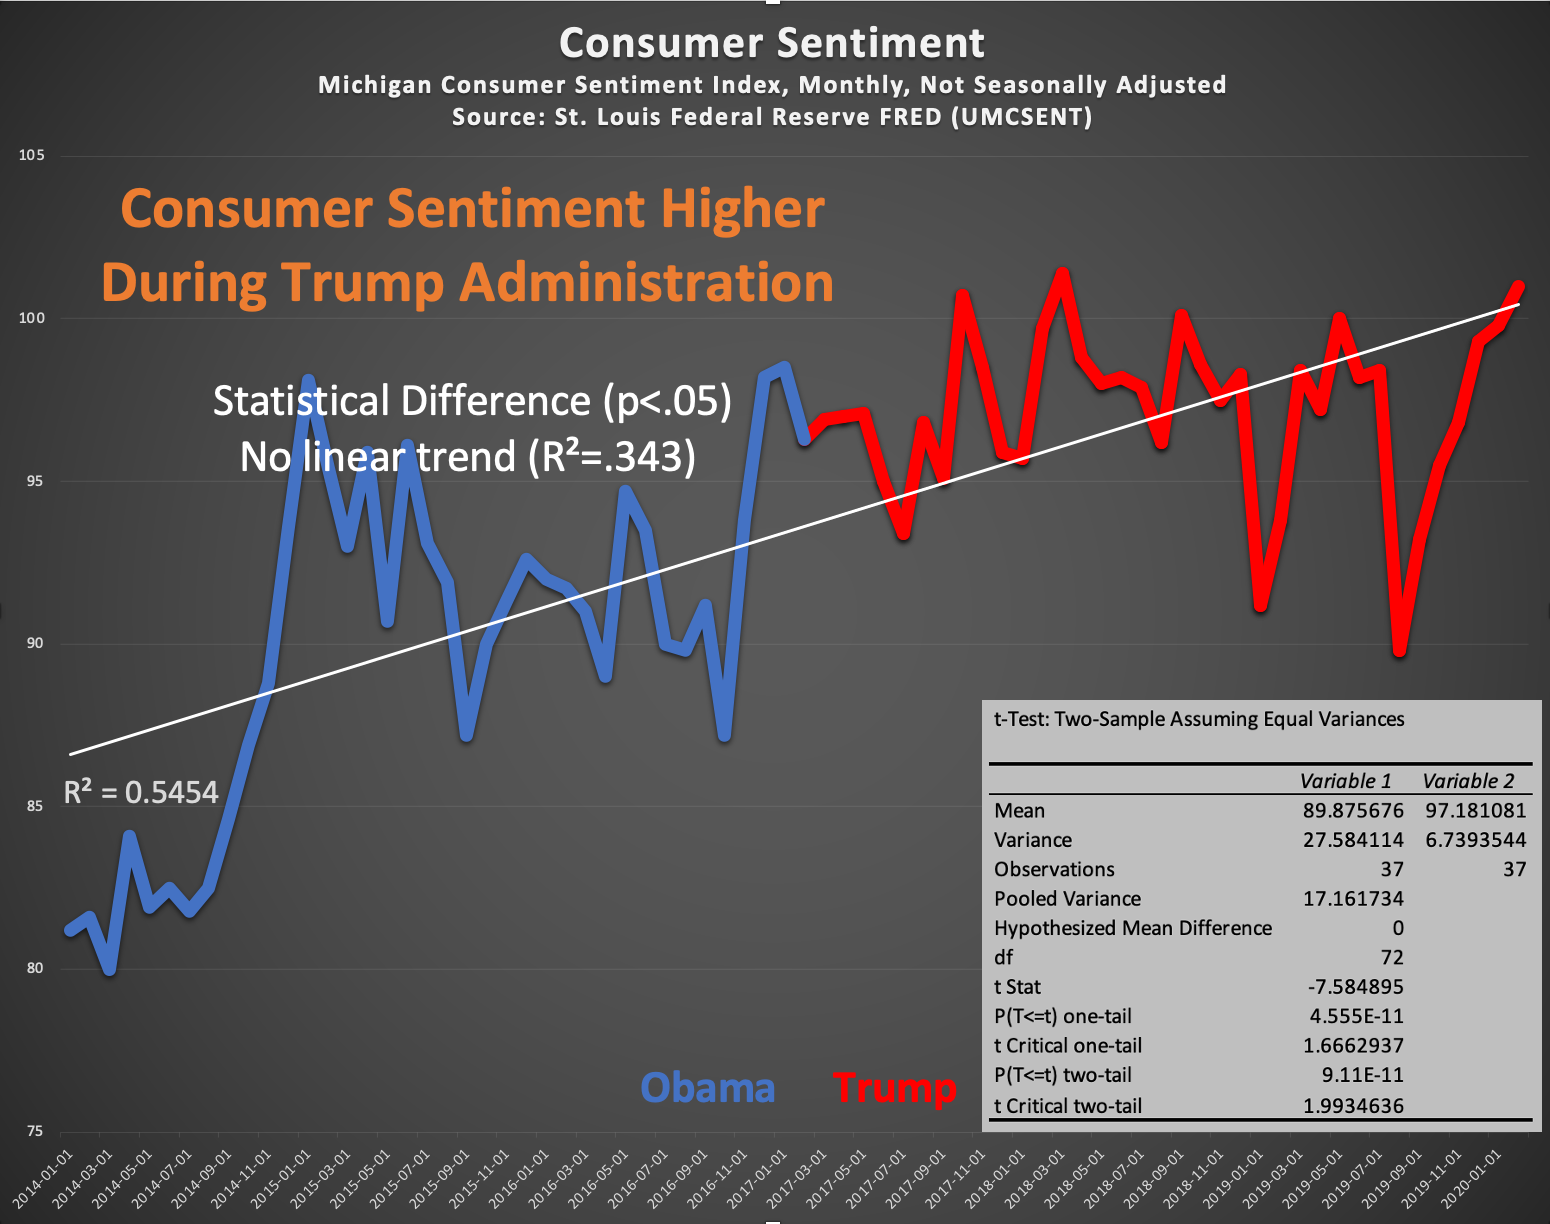
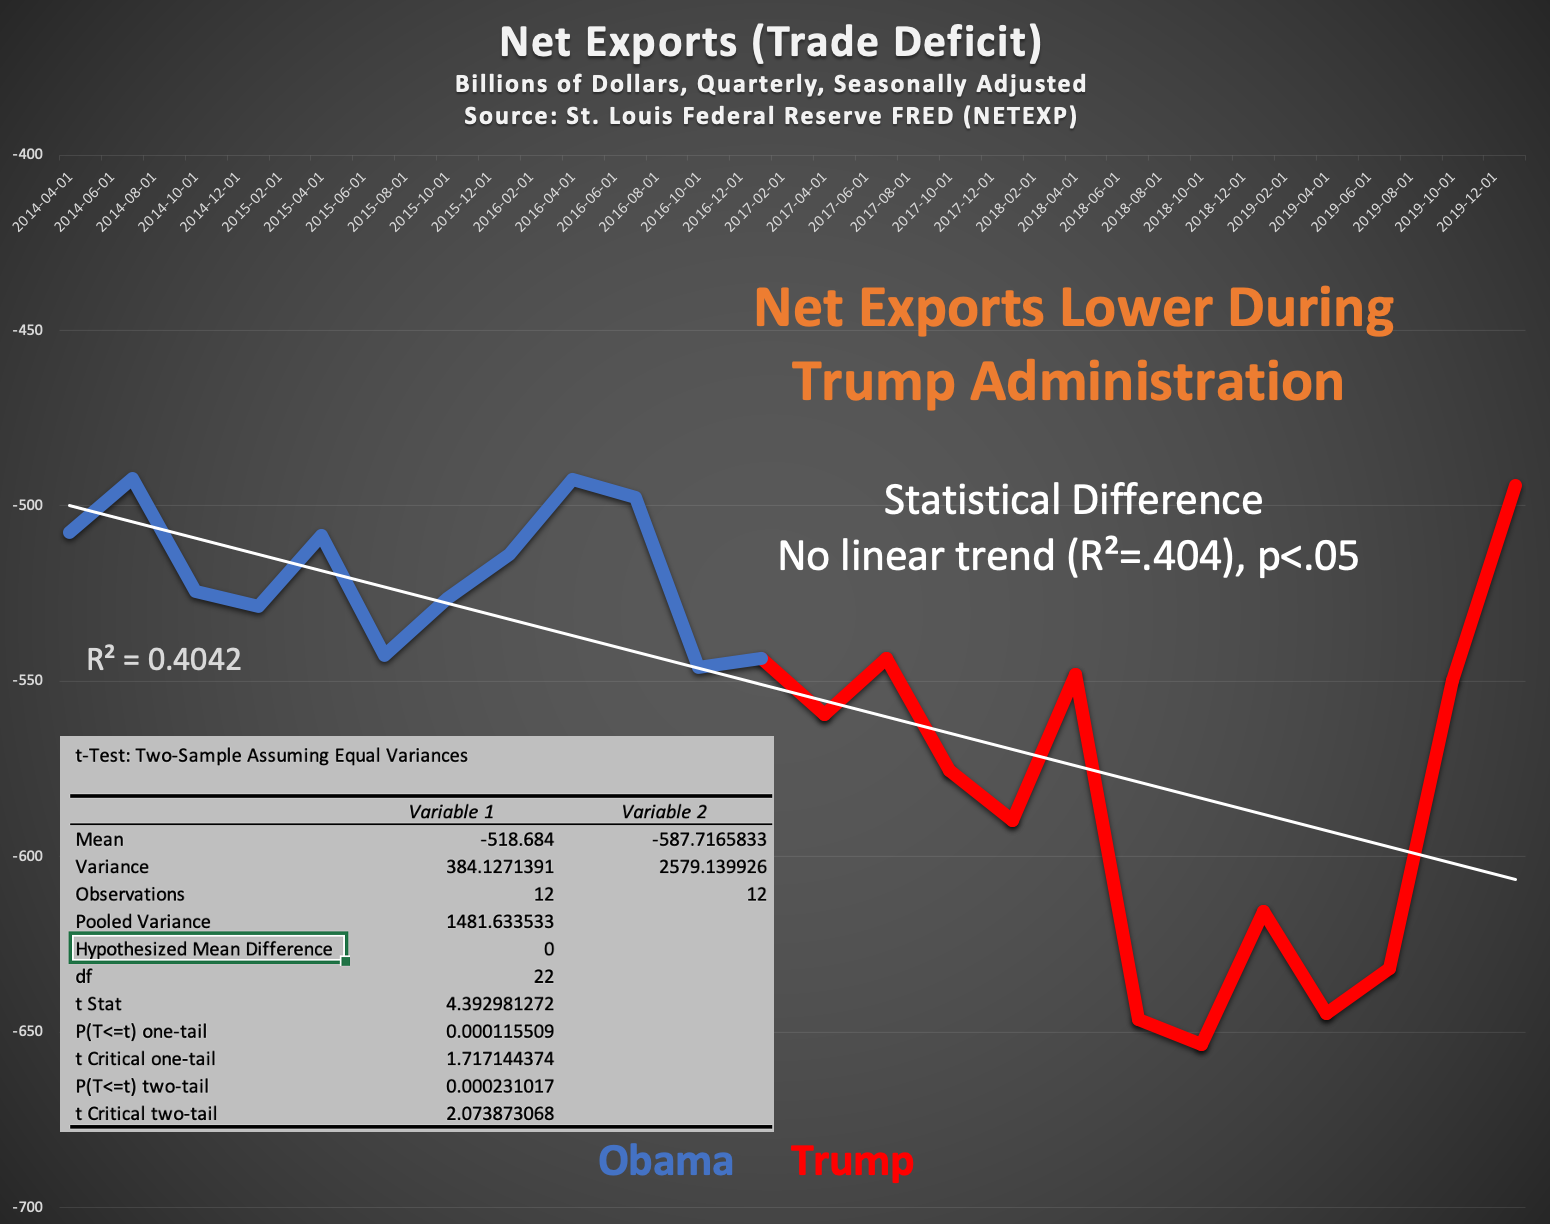
The areas of difference between the two administrations show that: Consumer Sentiment is statistically higher (better) under the Trump Administration, Federal Debt as a Percent of GDP is higher (worse) under the Trump Administration and the Trade Deficit (Net Exports) is lower (worse) under the Trump Administration.
These are the key high-level metrics used by economists to judge the overall performance of the US economy. One question I can anticipate is where is the unemployment rate? Unemployment rate is an outcome of jobs created and the population. The change in unemployment would be the proper metric in this case, but it would have been unfair to the Trump Administration because as we approach full employment (about 3%) the rate of change will slow. Labor Force Participation Rate for citizens age 25-54 is used in its place.


All data was sourced from the St. Louis Federal Reserve Economic Data (FRED) at https://fred.stlouisfed.org. The names of each data series is in the title for each chart. Here are direct links to the data: